Genética Populacional - Princípio de Hardy-Weinberg e Genética do Câncer
Table of Contents
- Common Terminology in Population Genetics
- Genotype and Allelic Frequencies
- Measuring Genetic Variation
- The Hardy–Weinberg Principle
- The Punnet Square
- Hardy–Weinberg in Autosomal Recessive Disease
- Hardy–Weinberg in X-linked Disease
- Factors Responsible for Genetic Variation
- Cancer Genetics
- Oncogenes and Tumor Suppressor Genes
- Cancer Hereditary and Expression Profiling in Prognosis
- References
Common Terminology in Population Genetics
- A population can be defined as a group of interbreeding persons that are present together at the same time.
- Genetic variation is the degree of differences seen among individuals such as height, color, etc.
- Genotype is the term given to particular set of genes carried by an individual.
- Gene pool is basically collection of all the genes found in a population.
Genotype and Allelic Frequencies
There are 23 pairs of chromosomes or a total of 46 chromosomes in each cell of the normal human body. Each chromosome is made of several thousand genes which contain the code for protein synthesis. The genes are located on the chromosome at the genetic locus and each locus has two genes, with one inherited from each of the parents. A variant or alternative form of the gene arising as a result of a mutation is called an allele, which is located at the same position as the gene and controls the same characteristic as the gene.
Genotype is the unique permutation and combination of genes in an individual which determines how and which proteins are to be synthesized by that individual’s body. On the other hand, a phenotype determines the external appearance of the individual and is different from the genotype as not all the instructions in the gene are expressed (or synthesized).
Measuring Genetic Variation
The mean number of alleles (MNA) is calculated manually to indicate the allele frequency for different populations in equilibrium. It is an indicator of genetic variation when calculated over several loci. A low MNA means low genetic variation which is found in populations who are genetically isolated (inbreeding) or as a result of population bottlenecks or associated with founder effects. On the other hand, if the MNA is high, it indicated greater allelic diversity, probably as a result of crossbreeding.
Variation in gene frequency amongst loci and different breeds is calculated using chi-square analysis, while contingent chi-square analysis helps to determine independent genotypes in all breeds.
The Hardy–Weinberg Principle
In a population at equilibrium, allelic and genotypic frequencies in that population will remain constant from generation to generation.
Godfrey Hardy & Wilhelm Weinberg, 1908
According to this principle, when the gene and genotype frequencies remain constant over generations, the population is said to be in Hardy-Weinberg equilibrium (HWE). This presumes:
- that the population is large,
- that there is no immigration or emigration of individuals in the population,
- that there is no mutation,
- that there is random mating, and
- there is no natural selection.
Mutation, migration, and selection with the non-random union of gametes can influence gene and genotype frequencies. Deviation from HWE can occur as a result of inbreeding, genotyping problems or population stratification. Several statistical methods help to calculate the deviation.
Genotype frequency calculation
Assuming that the total genotype frequency is 1.0, the hypothetical frequency of each genotype is calculated as the number of individuals in the population with that genotype divided by the total number of individuals in the population.
Table 1: Calculation of genotype frequency
Allele frequency calculation from genotype frequencies: Using genotype numbers, the population allele frequencies can be calculated. The total number of allele copies in the population divided by the total number of all alleles of the gene provides the allele frequency. For example:
Since there are 788 individuals in the population and since they are diploid, the total number of alleles will be 2000
So, the frequency of the dominant allele A in the population will be 1428/1576 = 0.906
And. as the total allele frequency is 1.0, and since there are two alleles, A and a
Derived recessive allele a frequency = 1.0 -0.906 = 0.094.
Genotypic frequency calculation from allele frequencies
If the population is in equilibrium, Hardy and Weinberg postulates that it should be possible to calculate genotype frequency from the allele frequencies; if it is presumed that the frequency of dominant allele A = p and recessive allele a = q, then,
And as there are only two alleles and the sum total of three probable genotypes is 1.0,
p2+ 2pq +q2 = 1
For example, using values from the example mentioned above in the formula:
(0.906)2 + 2 (0.906) (0.094) + (0.094)2 = 1
i.e. 0.821 + 0.170 + 0.009 = 1
The Punnet Square
This is a diagram designed by Reginald Punnet to calculate the probability of a couple bearing an offspring with a specific genotype. For example, consider the trait (phenotype) eye color:
A = black color, a = brown color
If the mother and the father have the genotype Aa = black eyes, then the probability of their offspring having genotype AA = 25%, Aa = 50% and aa = 25% which means that three children born to this couple will have black eyes, while one will have brown eyes.
Hardy–Weinberg in Autosomal Recessive Disease
In certain genetic disorders, such as autosomal recessive conditions, the allele is rare and there are more heterozygotes compared to homozygotes. This means that 2pq is much greater than q2. For example, the incidence of phenylketonuria (PKU) is 1 in 10,000 live births and it is difficult to calculate the number of heterozygotes but, using the H–W principle, it is possible to calculate the number of heterozygous carriers as follows:
q2 = 1/ 10,000, therefore q = 1/100 = 0.01
Since p + q = 1, p = 1 – q = 0.99
Therefore 2pq = 2 x 0.99 x 0.01 = 0.02 is the incidence of heterozygous carriers.
Predicting the probability of the progeny having the condition – for example, if the mother has PKU (homozygous) and the father is a carrier (heterozygous and has a 50% chance of passing a recessive allele to his offspring), and then using the above-mentioned calculations, it is possible to calculate the incidence of PKU in their offspring:
0.02 x 0.50 = 0.01 = 1% probability of the couple bearing a child with PKU
Hardy–Weinberg in X-linked Disease
Conditions like hemophilia and color blindness are inherited as X-linked disorders. The allele frequency in these disorders can be calculated by observing the number of males with the conditions as males have only one X-chromosome (hemizygous). For example, consider color blindness and the following table:
The incidence of female carriers (heterozygous i.e. 2pq) will be:
2pq = 2 (0.08) (0.92) = 0.1472 which means that approximately 15% of the women will be carriers of the allele.
Factors Responsible for Genetic Variation
The Hardy-Weinberg principle assumes an ideal equilibrium between the genotypic and allelic frequencies without mutations, or genetic drift or natural selection or random mating in a large freely interbreeding ideal population. However, over time, to enable the population to survive, the population’s gene pool can change and the change depends upon several factors which can be classified as genetic factors, environmental factors, and societal factors.
- Genetic factors, e.g. random mating, mutation, genetic drift, natural selection.
- Environmental factors, e.g. diversity in the environment.
- Societal factors, e.g. population size, migration of populations.
Mating
Mating can be either:
Consanguineous mating, mating between relatives or inbreeding is the most common form of non-random mating. This increases homozygosity, decreases heterozygosity, and deviates from the H-W principles. Inbreeding can be harmful with rare recessive alleles becoming homozygous and manifesting phenotypically. Amongst humans, the commonest type of inbreeding is between first cousins.
Or:
Stratification occurs when mates are selected from a restricted sub-group.
Or Assortative:
in this type of mating, like attracts like and can actually be beneficial.
Mutation
Mutation is defined as a structural change in the gene and formation of gene variants which are transmitted over subsequent generations. Alterations in the DNA or deletion, insertion, or re-arrangement of genes or chromosomes can lead to mutations which are the main cause of genetic variation. They are usually deleterious, but can sometimes be beneficial too.
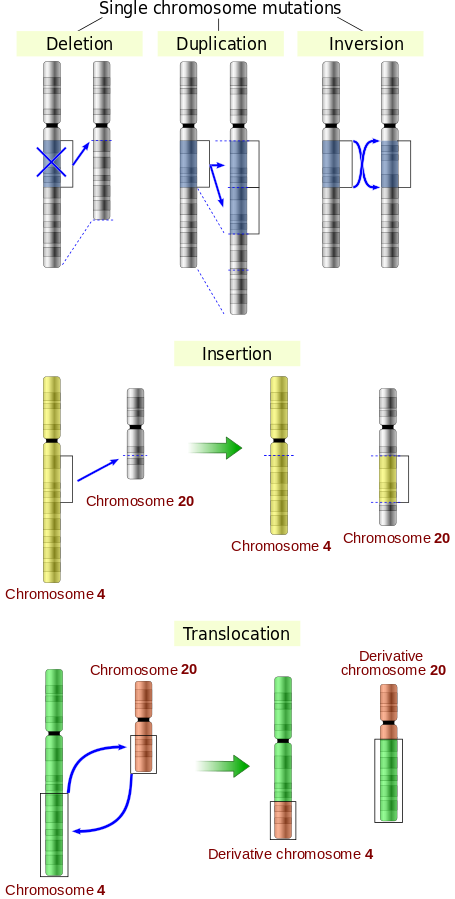
Illustrations of five types of chromosomal mutations.
Genetic drift
Random fluctuations during allele transfer from one generation to the next are called genetic drift. This occurs when small populations are formed due to an adverse environment (bottle neck effect) or due to the separation of a subset of the population geographically (founder effect). Genetic drift leads to random changes in allele frequencies over time, but does not lead to deviations from the HW equilibrium like inbreeding.
Bottleneck effect
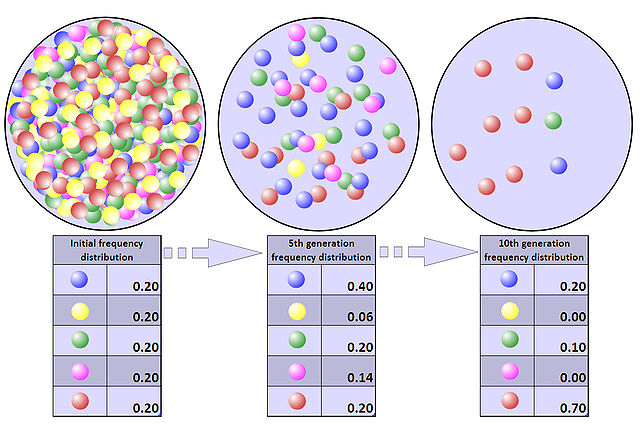
Image: “Representation of a population bottleneck. Colored balls represent the alleles present in the population. The population numbers 500 initially, but, within five years, the size of the population has dwindled to 50, and, within ten years, to just ten. As a consequence of the population bottleneck, there has been a random drift in the allele frequency distribution and a loss of two of the original five alleles.” by Professor Marginalia – Own work. License: CC BY-SA 3.0
Founder effect
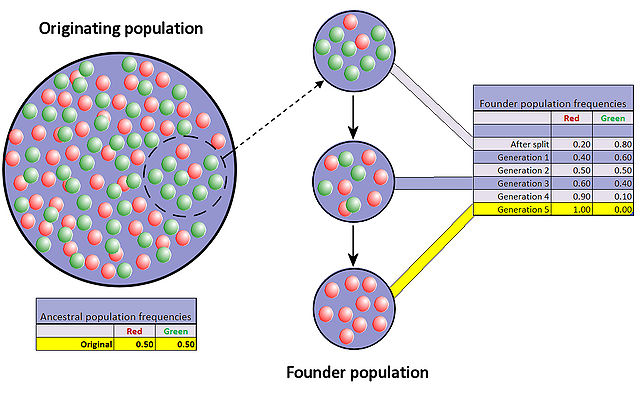
Image: “Representation of the founder effect: The colored balls represent the two alleles for a specific locus which are present in a hypothetical population; once a random sub-group of a population becomes separated from its ancestral population, the allele frequencies in the two groups’ subsequent generations can diverge widely within a relatively short period of time as a consequence of a purely random selection of alleles for reproduction.” by Professor Marginalia – Own work. License: CC BY-SA 3.0
Natural selection
Natural selection is the process whereby genotypes, which promote survival of the species in the existing environment, become more common and increase in frequency among reproducing individuals from one generation to the next. This enables the individuals within the population to adapt to the environmental conditions, survive and reproduce.
The effects of natural selection are directional. The allele can either be beneficial and increase within the population’s gene pool, or be deleterious and then disappear from the gene pool. Different population have different habitats, natural selection can create differencesamong populations through different alleles in different areas.
The best example of this is sickle cell anemia: Homozygous individuals with two copies of the mutant gene for sickle hemoglobin (HbS/HbS) suffer from the disease, while heterozygous individuals (HbS/HbA) are carriers of the condition. These heterozygous individuals are known to be resistant to malaria, compared to the homozygous individuals or those with the normal gene (HbA/HbA). This natural selective advantage is responsible for the maintenance of the HbS gene in the population.
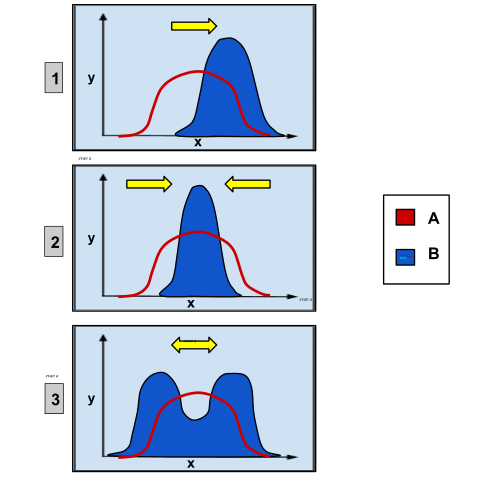
Image: “These charts depict the different types of genetic selection. On each graph, the x-axis variable is the type of phenotypic trait and the y-axis variable is the amount of organisms. Group A is the original population and Group B is the population after selection. Graph 1 shows directional selection, in which a single extreme phenotype is favored. Graph 2 depicts stabilizing selection, where the intermediate phenotype is favored over the extreme traits. Graph 3 shows disruptive selection, in which the extreme phenotypes are favored over the intermediate.” by Ealbert17 – Own work. License: CC BY-SA 4.0
Cancer Genetics
Cancer is a disease caused due to changes in our genes. These changes can be due to mutation in the DNA and can be either:
Inherited changes, i.e. they are present in the reproductive cells of the ova and the sperm. These are known as changes in the germ line and are present in every cell of the progeny.
Somatic changes, i.e. acquired during the lifetime of the individual due to exposure to carcinogenic chemicals, tobacco, radiation etc.
Oncogenes and Tumor Suppressor Genes
A single mutation rarely causes cancer. Multiple mutations over a lifetime accumulate in the genes which determine cell proliferation and apoptosis leading to the development of cancers. Therefore malignancies are usually observed in the elderly. A majority of the cancers are sporadic, but a few are inherited.
Tumor suppressor genes are genes which control the rate of cell growth, monitor cell division and repair mismatched DNA. Mutation of a tumor suppressor gene leads to uncontrolled proliferation of cells leading to the formation of a tumor. For example, tumor suppressor genes are p53, BRCA1, and BRCA2. A majority of the cancers are due to p53 gene mutations and these are usually acquired mutations. Germ cell mutations of p53 are rare and include Li Fraumeni syndrome. On the other hand, mutations of BRCA1 and BRCA2 are associated with a high incidence of hereditary ovarian and breast malignancies.
Oncogenes are genes whose mutations lead to the development of malignancies, for example, ras and HER2. The ras genes control protein synthesis which regulates pathways of cellular communication, cell growth, and apoptosis, while HER2 genes control growth and spread of cancers, especially breast and ovarian cancers.
DNA repair genes help to repair the errors during DNA duplication, but mutations in these genes can lead to malignancies, especially if the mutation occurs in a tumor suppressor or oncogene. DNA repair gene mutations can be either acquired or inherited e.g. Lynch syndrome.
Cancer Hereditary and Expression Profiling in Prognosis
Genetic microarray analysis is the study of variations in genetic transcription between normal and malignant cells. It helps to differentiate between gene expressions amongst hundreds of genes and create expression profiles of the genes for various types of malignancies. It has revolutionized our understanding of the heterogeneity of malignancies, serving as a prognostic indicator and to develop targeted treatments. For example, expression profiling in breast cancer is useful to screen hormone receptors estrogen/progesterone, HER2 oncogene amplification and exclude metastatic lymph nodes.


Comentários
Enviar um comentário